Background
Chlamydia trachomatis (CT) is a sexually transmitted pathogen that is the most common notifiable infectious disease in Canada, accounting for >50% of all reporting (1). Medical consequences of CT include pelvic inflammatory disease (PID), chronic pelvic pain, ectopic pregnancy, and tubal infertility in women, epididymoorchitis in males, enhancement of both HIV transmission and acquisition, and eye and lung disease in newborn infants (2). Asymptomatic infections are most common (3) and insidious effects of asymptomatic CT infection may result in health and health economic impacts that exceed those associated with clinically apparent infections.
In Canada, the reported rate of CT infection has climbed since 1997 from 113.9 cases to 258.5 cases per 100,000 in 2009 (1), and incidence of infection is 2% in some Northern communities (4). Chlamydia is theoretically controllable through screening, and meets all of Wilson and Jungner’s criteria for a disease amenable to public health screening (5). Although the Public Health Agency of Canada advocates that sexually active women undergo regular screening for CT (6), the impact of even heavily-funded and widely-applied screening programs in Canada has been limited, with CT rates continuing to rise and increased time and resources being allocated at the local public health unit level to contact tracing and partner notification. After an initial decline, CT prevalence increased 57% in Canada between 1991 and 2009, a period during which screening was widespread (6). Similar “rebound” has been observed in other regions, and has spurred calls for reduction or elimination of CT screening (7-9).
Surging rates of CT despite expanded screening have been variously attributed to increased case finding, increased prevalence of infection risk due to behavioural “risk compensation” (10), and immunologically mediated “rebound” due to increasing the number of susceptible individuals through treatment (7). As rapid reinfection of cases has been associated with failure to treat infected sex partners (11-13), partner notification and treatment is increasingly emphasized as a cornerstone of efforts to control the spread of CT. Partner notification in Canada typically occurs via patient or healthcare provider/public health referral of sexual partners to appropriate services for testing and treatment (6). Expedited partner therapy (EPT, also known as patient-delivered partner therapy (PDPT)), is an alternative to traditional partner notification in which an index case directly provides treatment to sexual partners without a healthcare provider first examining the partner. EPT has been demonstrated in several randomized trials to result in fewer reinfections with chlamydia than traditional partner notification (14, 15), although the impact was modest in some studies (16, 17), and it is unclear if these results translate into real-world effectiveness (18).
The objective of this project was to use an agent-based mathematical model of CT transmission to evaluate potential intervention strategies, with the aim of optimizing the use of limited healthcare and public health resources to minimize CT infection. Mathematical models, while not a substitute for randomized clinical trials (RCT), are a useful tool for evaluating health policy when RCT-based evidence is absent or insufficient, when important health and economic outcomes accrue to individuals not participating in the trial itself, and when the policy-relevant time horizon exceeds the attainable duration of a clinical trial. Such models can also serve to identify important and influential areas of uncertainty, which can be the focus of future research.
Methods
Transmission model overview
We developed an agent-based model that represents a core population of highly connected heterosexual males and females (19). These individuals form a network of sexual contacts across which the transmission of CT can occur. Agent-based models simulate infectious diseases by considering each individual (“agent”) in a population as a distinct entity (20, 21). These models allow for explicit modelling of sexual partnership dynamics, including partner concurrency and complex sexual networks, and can record the sexual histories of discrete individuals in populations. They capture re-infection within partnerships and allow for the explicit modelling of partner notification. Disadvantages of these models include lack of mathematical tractability and their computationally intensive nature, making them less desirable for the simulation of extremely large populations. We used an agent-based model to evaluate the effectiveness and health economic attractiveness of network-based disease control strategies, such as patient-delivered partner therapy and outreach efforts that seek to identify and treat highly connected “core” individuals within a population.
The model population consisted of 2,000 heterosexual individuals with a female to male ratio of 1:1. There were two major components describing the state of each individual in the model: an infection transmission component and a partnership component. Each of these components is described in more detail below.
Partnership component
The partnership component described an individual’s sexual network, as measured by the number of sexual partnerships at a given point in time. Each individual was assigned a target number of desired partners per year (drawn from a distribution, see Table 1) and formed partnerships with other partner-seeking individuals in the model population at a rate determined by that target. Partnerships could be concurrent or serial. We further distinguished between regular (lasting at least 1 month) and casual partnerships (1 to 30 days). We differentiated between casual and regular partnerships for the application of different behavioural characteristics, such as frequency of sexual contact and likelihood of partner notification.
Infection transmission component
The infection transmission component represents an individual’s health state and incorporates the natural history of CT infection (Figure 1). The model had a Susceptible-Infected-Recovered-Susceptible (SIRS) structure, with susceptible individuals becoming infected (and infectious to others) following contact with an infected partner.
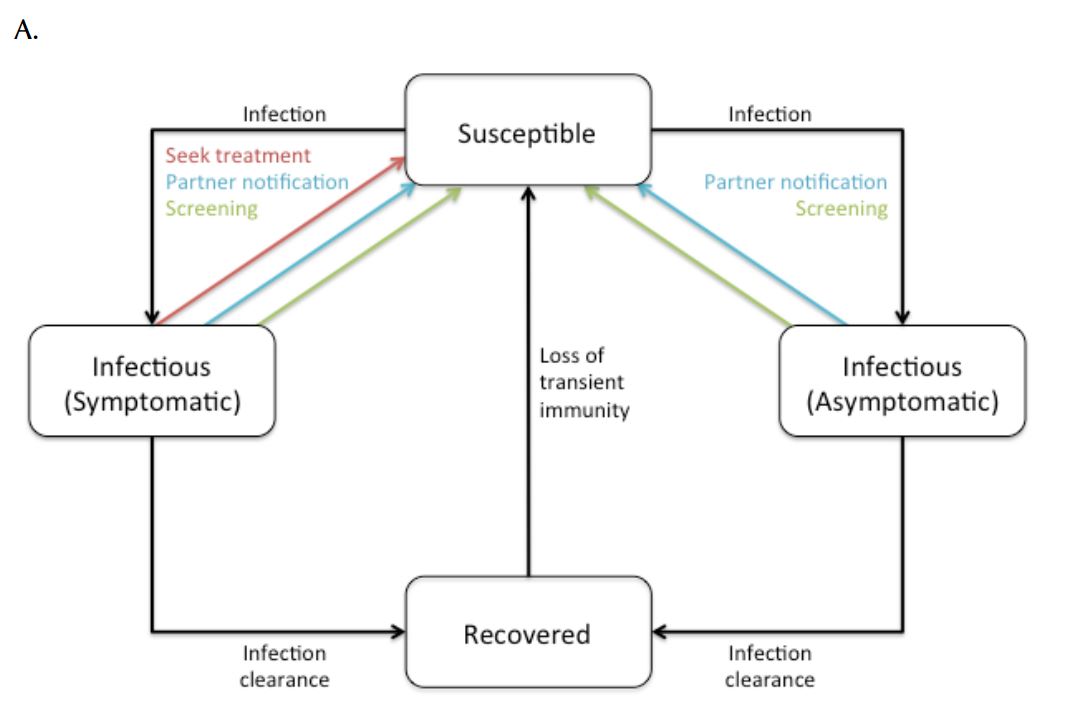
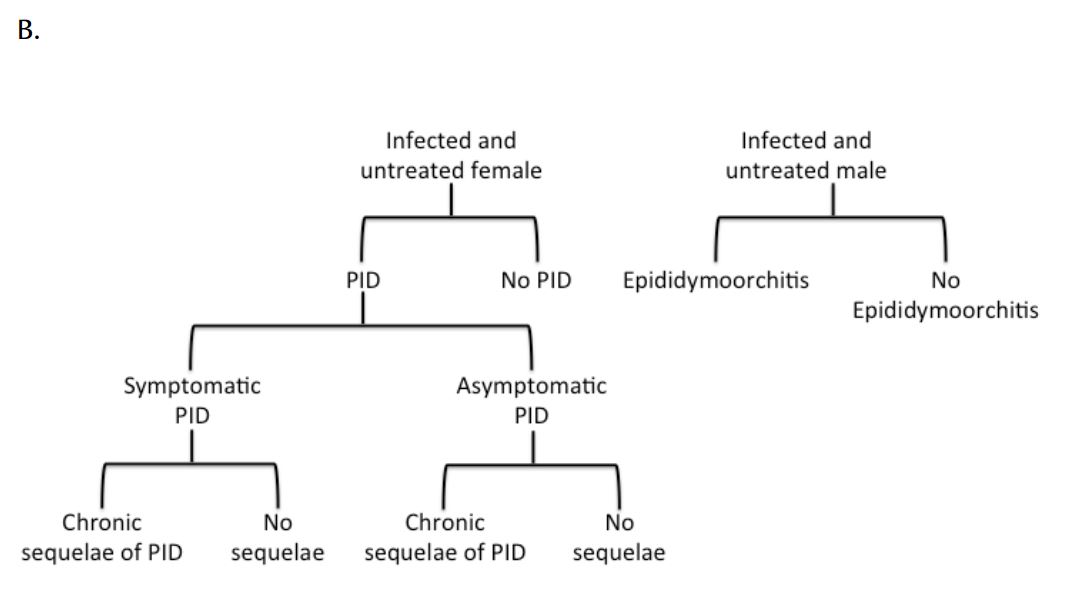
Figure 1. Simplified overview of (a) transmission model and (b) natural history of CT infection. Symptomatic and asymptomatic infections are distinguished due to different probabilities of treatment.
Following natural clearance of infection, individuals moved to a transiently immune “recovered” state. Mathematical and experimental animal models suggest that natural clearance of CT infection is followed by a transient immune state (7, 22, 23), with the existence of such a state consistent with “rebound” in CT epidemiology observed in jurisdictions that have instituted large-scale screening programs (7, 9). Following this transiently immune period, individuals returned to the susceptible state and were re-infectable. Treatment of infectious individuals (as a result of actively seeking treatment, screening, or partner notification) was assumed to abort the development of protective immunity, with infected individuals returning directly to the susceptible state following effective treatment.
The natural history of CT infection was modelled using a previously described approach (9, 24), with individuals experiencing symptomatic lower genital tract infection promptly identified and treated according to Canadian guidelines (6) (Figure 1). Individuals with asymptomatic infection could be identified prior to the onset of PID as a result of screening. Women with asymptomatic lower genital tract CT infection were at risk of progressing to symptomatic or asymptomatic PID and chronic sequelae (chronic pelvic pain, ectopic pregnancy, and tubal infertility). We assumed that women who developed PID during asymptomatic infection did so at the midpoint of infection. Complications of CT infection in males, such as epididymitis, were estimated using the approach of Mehta et al. (25). Although additional costs and consequences of CT infection include vertical transmission to neonates and excess immunodeficiency virus (HIV) infections, these adverse effects of infection were not included in the model due to difficulties in estimability.
Health economic model overview
The model included a health economic component; the number of infections, screening tests conducted, infections treated, and downstream sequelae associated with untreated CT infections were tracked in the transmission model and were used to estimate the total cost of CT infection in the model population. We employed a modified societal perspective, with all costs considered, regardless of to whom they accrued, but time and travel costs were not estimated. The principal variable costs were costs of tests and medications. We assumed that costs of testing and treatment of individuals with symptomatic lower genital tract infection were the same as costs of testing and treatment of asymptomatic infection. We used the estimates of Hu et al. (24) with respect to the weighted average cost of inpatient and outpatient treatment for symptomatic PID as well as costs of long term sequelae of symptomatic and asymptomatic PID (24). Detailed data on cost inputs are provided in Table 2. Costs associated with contact tracing and partner notification were based on estimates derived by Gift et al. (26). All costs were converted to year 2009 Canadian dollars using the health and personal care component of the Canadian Consumer Price Index (27) and were discounted to present value at 3% per annum (28).
Model parameterization
Parameters describing the natural history of CT infection, as well as costs associated with infection, screening, and treatment were obtained from the literature, where available (Table 1 and 2). Given the limited population size that can be modelled using an agent-based approach, the model is appropriate for studying disease transmission in small populations that experience high rates of infection due to core group dynamics (e.g. groups who exhibit high-risk behaviours such as high rates of partner change). We used data from a general population survey of sexual activity of the heterosexual population in province of Quebec to model sex behaviour in the Canadian population, extracting data for individuals who reported two or more partners in the previous 12 months (29).
Model calibration and analysis
Each model replication represents one realization out of many possible epidemic trajectories. We examined model-projected annual reported infection rates to ensure that the model was generating realistic patterns of infection in the model population for each replication. In the absence of specific data on CT infection in core group populations, we used reported CT rates for the year 2009 in the general Canadian population aged 20–24 (the age group with the highest reported CT rates in Canada) to calculate the lower bound estimate of the expected number of CT cases in our population (1). However, it would be expected that incidence of infection in the core sub-population modelled here would be far higher. By way of comparison, the prevalence of gonorrhea in a core population in central Toronto is approximately 100-fold higher than that seen in Canadian men in general (30). We regarded model replications as “credible” if they produced incident case counts that were up to 5-fold greater than that expected for the general Canadian population during the time horizon used in the model (i.e., simulations were retained if less than 140 reported infections occurred annually in the pre-intervention period). A total of 1000 well-calibrated model replications were used for the analysis of each intervention.
We estimated the relative effectiveness and cost-effectiveness of the competing CT control strategies described in Table 3. For each model replication, we ran the model for a total of 15 years. For the first 5 years (pre-intervention period), all simulations were run using the “current standard of care plus partner notification” scenario (intervention 4, Table 3) assumptions. These years were used to select well-calibrated simulations. After 5 years, the specific interventions described in Table 3 were applied for a period of 10 years, a time horizon that we regarded as likely to be meaningful to public health decision makers.
1000 replications were run for each model scenario, with the mean value and bootstrapped 95% confidence intervals presented. The primary outcome assessed was the number of infections and downstream complications of CT infection projected for the different strategies. We present both reported cases (i.e., those identified through testing of symptomatic individuals presenting for medical care, opportunistic screening, or contact tracing) and total cases (i.e., the total number of CT cases in the population). Incremental cost-effectiveness ratios (ICER) were also assessed; outcomes and costs in the `no intervention’ scenario (strategy 1: treatment of symptomatic infections only) were compared to the other scenario results, to estimate the cost per quality-adjusted life year (QALY) gained. PID was estimated to result in the downstream loss of approximately one quality-adjusted life year, mainly due to infertility and chronic pelvic pain (31).
Results
Model-projected CT prevalence over a ten-year period is presented in Figure 2 for the current standard of care plus contact tracing scenario in the core group of males and females. Since we assumed that only a proportion of asymptomatic cases were detected via screening and partner notification, we also estimated the underlying prevalence of CT in the population (i.e., all symptomatic and asymptomatic infections, model-projected total prevalence).
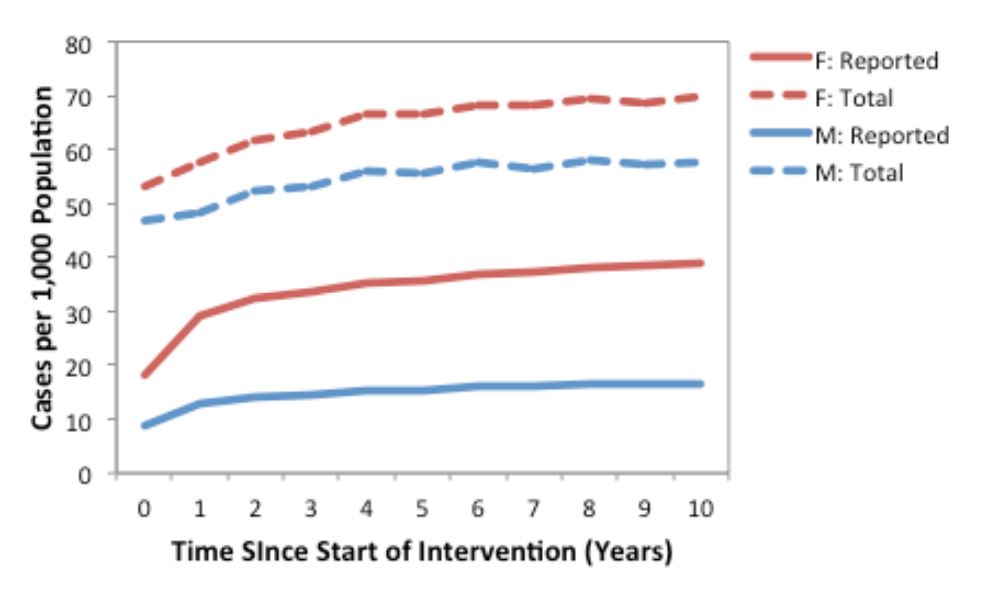
Figure 2. Annual number of model-projected reported (solid lines) and total (dashed lines) CT infections in a population of 1,000 males and 1,000 females, under the current standard of care plus contact tracing (strategy 4) assumptions. Results are based on the mean of 1000 replications. Reported cases include symptomatic infections and the proportion of asymptomatic infections detected via screening and partner notification, while total cases include all symptomatic and asymptomatic infections.
Projected impact of different interventions on Chlamydia trachomatis infections
We compared the model-projected number of CT infections in the presence of the different potential interventions (Figure 3). Relative to base case conditions (strategy 1) and considering a 10-year time horizon, all alternate strategies were projected to increase both the number of reported CT cases (as would be expected, given the increased intensity of screening efforts compared to the base case) and total CT cases in the model population.
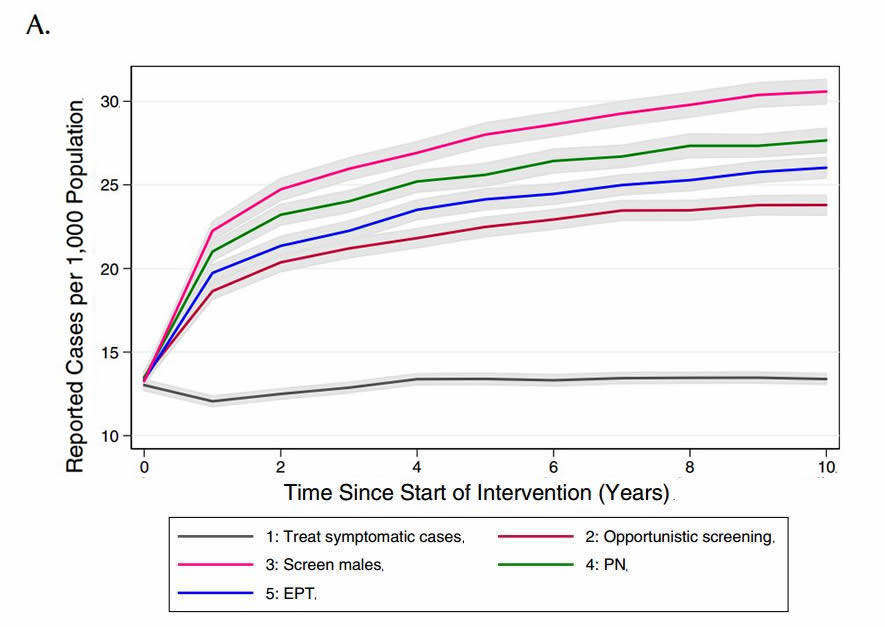
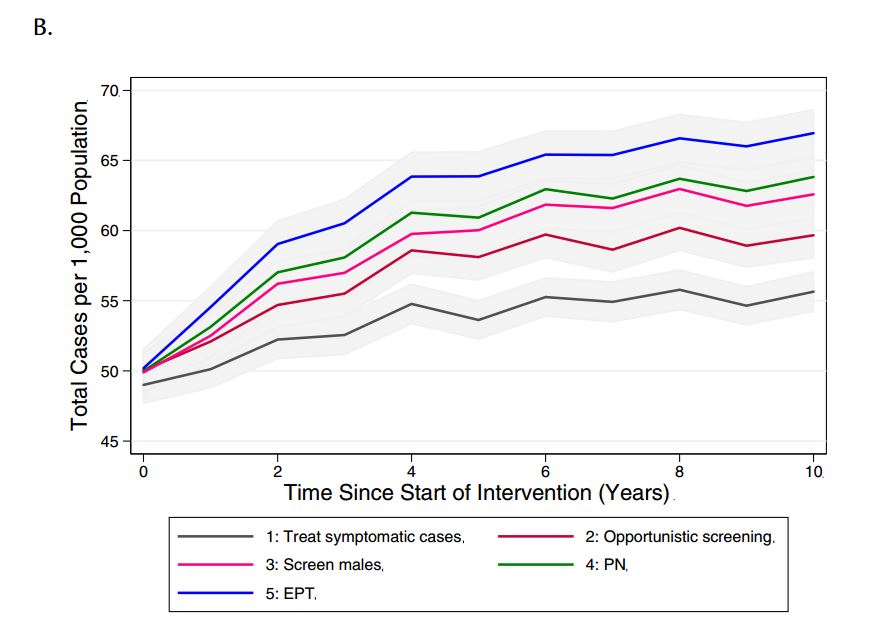
Figure 3. Model-projected number of (a) reported CT infections and (b) total CT infections under different chlamydia-control strategies, over a period of ten years. Results are presented as the mean of 1000 replications per strategy, with 95% confidence intervals are indicated by grey shading.
(PN: partner notification; EPT: expedited partner therapy)
We evaluated the impact of the various interventions on downstream sequelae of untreated CT infections by comparing the cumulative number of model-projected PID cases over the intervention period for each of the interventions, as well as the number of cases of PID per 1000 CT infections in females (Figure 4). Although the total burden of PID showed the same trend as was observed for infections (i.e., increasing number of cases with increasing intervention intensity), PID risk per infection was projected to decrease with increasing intervention intensity, with the lowest values observed for EPT.
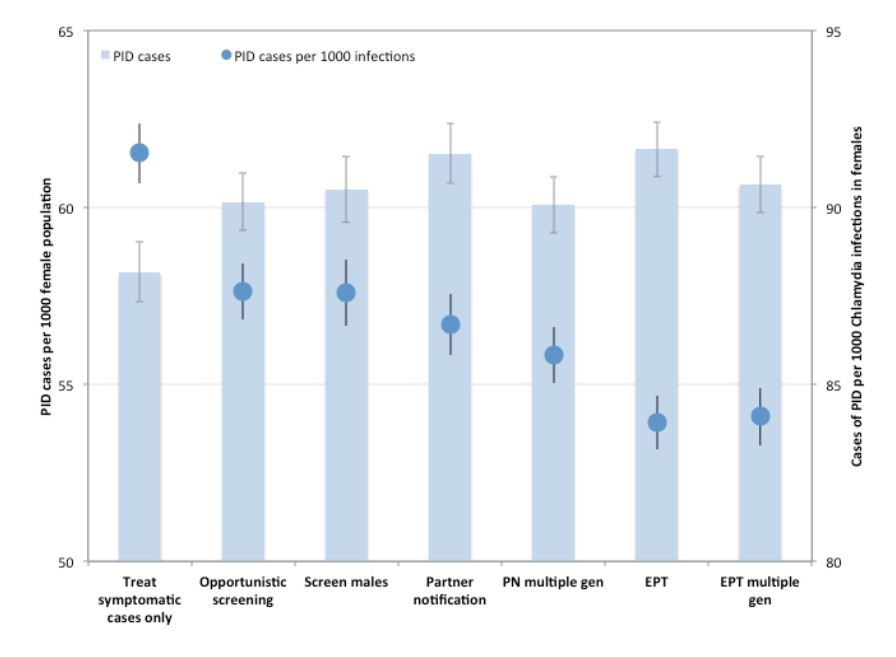
Figure 4. Impact of different CT control strategies on pelvic inflammatory disease (PID) risk. Total number of PID cases over the 10-year intervention period are shown for each strategy (bars). PID risk per 1000 CT infections in women is indicated by circles. Mean values are presented for 1000 replications per strategy, with 95% confidence intervals indicated by error bars.
(PN: partner notification; EPT: expedited partner therapy)
Projected cost-effectiveness of interventions
All of the interventions cost more, and prevented fewer CT infections, than the treat symptomatic cases only strategy (i.e., higher costs for fewer QALYs gained), and thus would not be preferred by policy makers. Similarly, when we used intervention 2 (screening at current levels) as the comparator, it dominated all of the other interventions.
Effect of intensity of contact tracing
Given that different jurisdictions have different policies around the need to continue contact tracing beyond one generation, we sought to evaluate the impact of continuing the case-finding process for multiple generations, until no further infectious cases were identified (see Table 4 for description of how these scenarios differed from those used in the main analysis). Although there was only a marginal decrease in reported cases observed with additional generations of case finding under partner notification and EPT, there was a decrease in total cases in the population relative to single-generation case- finding (Figure 5).
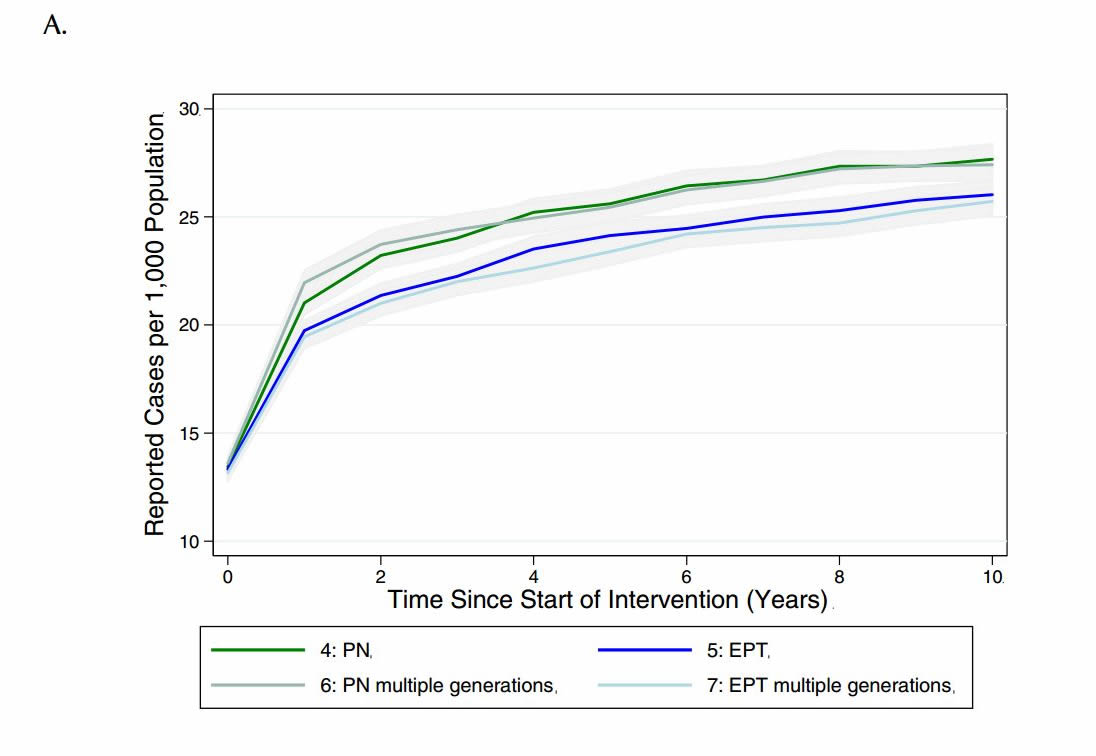
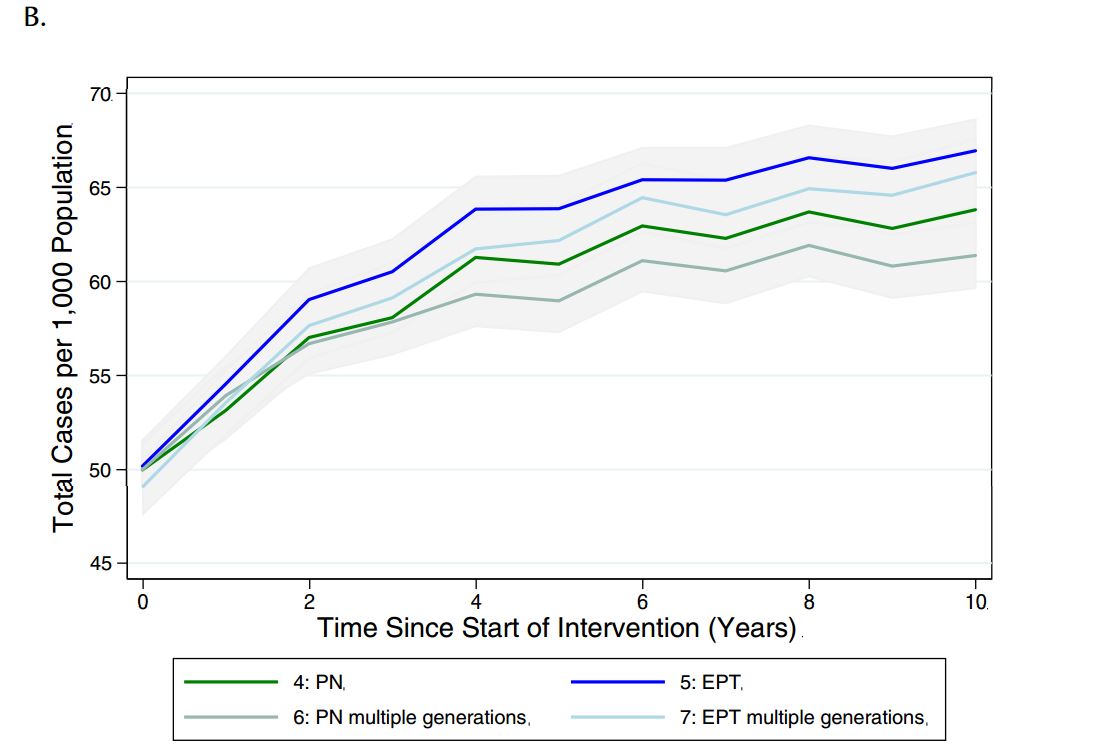
Figure 5. Model-projected number of (a) reported CT infections and (b) total CT infections in the presence of single or multiple generations of contact tracing, via standard partner notification (PN) or expedited partner therapy (EPT), over a period of ten years. Results are presented as the mean and 95% confidence intervals of 1000 replications per strategy in a population of 2,000 individuals.
Discussion
The epidemiology of genital Chlamydia trachomatis infections continues to pose a major challenge to public health practitioners and clinicians in Canada and elsewhere (31, 32). Notwithstanding the characteristics of this disease that should make it amenable to control via screening and treatment, intensive efforts aimed at CT control have been associated with elevated rates of disease in many jurisdictions, following an initial decline (7, 8, 31). As noted above, there are several possible mechanisms that could produce observed disease patterns; these can effectively be summarized as (i) an apparent increase in risk via increased case finding, with true burden of infection stable or falling; (ii) a true increase in case occurrence, possibly due to a change in disease dynamics created by screening activities; or (iii) some combination of (i) and (ii). This final scenario is supported by the modelling results reported above.
We have created an agent-based mathematical model that describes chlamydia transmission dynamics in a core group of highly sexually active heterosexual individuals and used this model as a platform to evaluate a number of plausible disease control strategies that are either currently in use, or being considered, by Canadian public health officials. Our findings in this high-risk sub-population suggest that the recent increases in CT incidence currently observed in some jurisdictions in Canada could plausibly be related to altered disease dynamics created by screening activities. Our major finding is that intensive screening activities in populations with relatively high rates of partner change, with or without adjunctive contact tracing, partner notification, or EPT, could result in increased total infections, and reinfections of individuals via truncation of CT- related immunity, but would reduce the duration of CT infection, thus reducing the per-infection risk of sequelae for infected individuals. The net result of these changes would be an approximately zero-sum change in population-level risk of such important sequelae as pelvic inflammatory disease.
Although these findings may appear discouraging to agencies that have invested heavily in CT control, and may appear counterintuitive to some, they would be unsurprising if identification and treatment results in the rapid return of the highest risk individuals in a given population to the susceptible class following treatment, in the presence of a dense network of sexual contacts (7, 33). Our projections also likely look particularly concerning because of our decision to utilize a “no-screening” strategy as our baseline, whereas many recent dynamic models of CT have assumed that background screening would occur regardless of the implementation of novel strategies (34, 35). Our decision is in keeping of U.S. Task Force recommendations, that suggest including a “do nothing” strategy as a baseline comparator (28).
Furthermore, these findings are consistent with empirical data from York Region, a public health jurisdiction in the greater Toronto area which possesses high-quality data on pelvic inflammatory disease incidence as well CT incidence (Figure 6). These data demonstrate increasing reported CT rates in women, with no change in PID risk, between 2003 and 2010, a pattern that would be strongly suggestive of reduced PID risk in individual infected women.
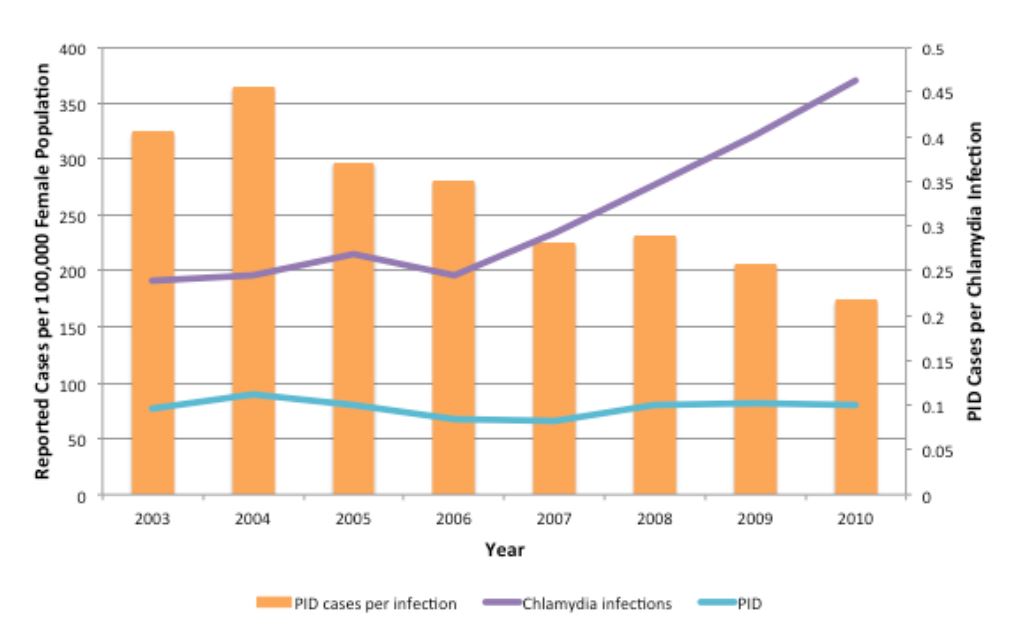
Figure 6. Trends in CT infections and PID cases in females aged 10–49 in York Region, Ontario, 2003–2010. Annual rates of reported CT infections (purple line) and PID cases (blue line) are shown per 100,000 female population. The ratio of PID cases per reported CT infections is shown by orange bars. PID cases include all hospitalizations, emergency department visits and day surgeries for which PID was the main diagnosis for patients residing within York Region.
Importantly, these findings imply divergent impacts for disease control programs at the individual level and population level. For example, it would be beneficial for an asymptomatically infected individual to be identified via screening, as evidence from randomized trials clearly demonstrate risk reduction for pelvic inflammatory disease in treated individuals (36). Our models suggest that this risk reduction paradoxically increases population-level risk of transmission by replenishing the pool of susceptible individuals in high-risk groups. Indeed, the effective reproductive number for an infectious disease (the number of secondary infections caused by a primary infection) is proportionate to the fraction of the population susceptible (37), so it is not unexpected that transmission of CT might increase with increasing susceptibility in the population. This observation is not only indirectly validated by data such as those from York region, but also provides a mechanism whereby dramatically different observations on CT epidemiology might be reconciled. For example, assuming that the unscreened control group in the trial by Scholes et al. had a similar prevalence of Chlamydia to those in the screened group, the fraction of CT-infected women who went on to develop PID would be estimated to be > 20% (36) whereas population-level estimates from the Netherlands have placed this risk below 1% (38). This may simply represent the very different natural histories associated with short duration and long duration CT infection, with short-duration infection becoming more likely, but less risky, when screening is widely available.
Such divergence (i.e., orthogonality of individual and population risk in the presence of disease control interventions) is not, in fact, novel. For example, Lipsitch and Bergstrom have demonstrated that some antibiotic utilization strategies in hospitals may have divergent effects on individual and population-level risk for acquisition of antimicrobial resistant microbes (39), and we have found that strategies that are most beneficial for infected individuals with gonorrhea may speed transmission of resistance at a population level (30). Similar orthogonality in benefit has also been reported in the context of vaccination (40). This tension between individual and community benefit is, in fact, one of the defining ethical dimensions of public health practice. Making this trade-off explicit in the context of a mathematical model thus allows policy-makers to meet this challenge head-on, though decisions involved may be complex.
Our model incorporated costs, as we had intended to perform a cost-utility analysis of competing strategies for CT control. However, as more resource intensive strategies were also either less effective in preventing CT and its downstream sequelae, or only marginally more effective, we found that most would be “dominated” by a no-screening strategy, or would not be considered cost-effective relative to currently available health interventions.
Like any model-based analysis, ours is a simplified representation of a complex, real-world system and consequently is subject to limitations. The computational intensity of the model leads us to evaluate interventions in small core groups, which may mean that the dynamics we identify and the effects of interventions projected here would differ from those seen in the wider community. Indeed, we have previously modelled the effects of CT screening in Canada as a whole and the results of that modelling work suggest that screening at a national level does indeed represent a cost-effective health intervention, and good value for money (31). A second limitation of our small-population approach is the relative instability of results due to stochastic variability. We have somewhat overcome this latter limitation through performance of large numbers of simulations. The model assumes a period of transient immunity from re-infection following natural clearance of CT infection, which is aborted following treatment; although there is evidence for immunity to reinfection in animals (22) and humans (23), the duration and degree of immunity remains unclear.
In conclusion, we used an agent-based model to evaluate a variety of plausible control strategies for Chlamydia trachomatis infection in a highly sexually connected “core” population. In this population, the impact of intensive screening, contact tracing and partner notification, and EPT, were projected to be disappointing, with reductions in duration of infection resulting in enhancement of transmission risk via replenishment of susceptible individuals in the population. Our model results suggest that recent dramatic increases in CT incidence in many jurisdictions in Canada may indeed be driven, at least in part, by screening efforts. While these strategies reduced per infection risk of PID, the overall increase in infections resulted in no reduction in total PID in the population, a pattern matching that seen in some Canadian jurisdictions. Given the potentially substantial implications of these findings, we encourage other modelling groups to evaluate this question in a manner that incorporates a non-screening baseline comparator strategy. Further work is also needed to evaluate the implications of such strategies for population-level risk when high-and low-risk populations are coupled.
Tables
Table 1. Model parameters
| Parameter | Value | Range | Distribution Type | Reference |
|---|---|---|---|---|
| Baseline probability of CT diagnosis (probability of symptomatic infection) | (3, 41, 42) and best estimates | |||
| Females | 0.1 | |||
| Males | 0.08 | |||
| Probability of transmission (per day) | (43) | |||
| Male to female | 0.154 | |||
| Female to male | 0.122 | |||
| Partnership duration (days) | Assumption | |||
| Casual | 14 | 1–30 | Triangular | |
| Regular | 300 | 31–3000 | Triangular | |
| Distribution of number of partners in past 12 months (proportion of population in each category) | (29) | |||
| 1–2 | 0.56 | |||
| 3–4 | 0.33 | |||
| 5+ | 0.11 | |||
| Frequency of sexual contact (per day) | Assumption | |||
| Casual | 0.5 | |||
| Regular | 0.25 | |||
| Probability of concurrent partnership | 0.1 | Assumption | ||
| Probability of screening | Estimated from Ontario Public Health Laboratory test volumes | |||
| Female | 0.2 | |||
| Male | 0.05 | |||
| Frequency of screening (per year) | 1 | Assumption | ||
| Trace-back period for partner notification (days) | 90 | (6) | ||
| Duration of CT, untreated (months) | 12 | 10–16 | Triangular | (44) |
| Duration of transient immunity, untreated CT (months) | 6 | 3–10 | Triangular | (7) and best estimates |
| NAAT test characteristics | (2, 24, 45) | |||
| Sensitivity | 0.90 | |||
| Specificity | 0.99 | |||
| Probability of PID with CT | 0.10 | (46-48) | ||
| Probability of symptomatic PID | 0.40 | (24) | ||
| Probability of complicated CT infection in males | 0.02 | (25, 49) | ||
| Treatment effectiveness | (50, 51) and best estimates | |||
| Female | 0.9 | |||
| Male | 0.9 | |||
| Probability of seeking treatment for symptomatic infection | (31) | |||
| Female | 1 | |||
| Male | 0.6 | |||
| Delay between notification and seeking treatment (days) | 5 | 1–14 | Triangular | (52) |
| Refractory period following treatment (days) | 14 | |||
| Probability of adverse drug reaction | 0.04 | (24) | ||
| QALY loss per PID case | 1 | (53,54) |
Table 2. Costs associated with Chlamydia trachomatis infection, screening, partner notification and treatment
| Cost component | Value (2009 $CDN) | Reference |
|---|---|---|
| Screening test costs | 16 | (9, 24) |
| Treatment costs (uncomplicated) | ||
| Brief patient encounter | 34 | (24, 25, 55) |
| Antimicrobial therapy | 13 | (24, 25, 56) |
| Adverse drug reaction | 65 | (24) |
| Partner notification costs (per index case) | 106 | (26) |
| Treatment costs (complicated) | ||
| Symptomatic pelvic inflammatory disease | 1,780 | (24, 55) |
| Epididymoorchitis | 230 | (25, 55) |
| Chronic sequelae of pelvic inflammatory disease | 2,410 | (24) |
| Discount rate | 0.03 | (28) |
Table 3. Control strategies for Chlamydia trachomatis infection evaluated in model
| Scenario | Description | Assumptions |
|---|---|---|
| (1) No intervention | Treat symptomatic cases only | 10% of infections in females are symptomatic |
| 8% of infections in males are symptomatic | ||
| (2) Screening | Treat symptomatic cases | Same as no intervention scenario plus: |
| 20% of the female population and 5% of the male population are screened annually | ||
| (3) Enhanced screening in males | Treat symptomatic cases | Same as screening scenario but: |
| Opportunistic screening and treatment | 20% of the female and male population are screened annually | |
| (4) Screening plus standard partner notification | Treat symptomatic cases | Same as screening scenario plus: |
| Opportunistic screening and treatment | Contact tracing for index case going back one generation | |
| Contact tracing and partner notification | 0.3 partners notified and treated per index case (35, 52) | |
| (5) Screening plus expedited partner therapy (EPT) | Treat symptomatic cases | Same as screening plus partner notification scenario, but: |
| Opportunistic screening and treatment | 0.6 partners notified and treated per index case (52) | |
| EPT | 25% of partners receiving EPT seek clinical care/are tested (26) | |
| Only partners who are tested are counted in reported prevalence estimates | ||
| (6) Partner notification for multiple generations | Treat symptomatic cases | Same as screening plus standard partner notification but: |
| Opportunistic screening and treatment | Contact tracing goes back multiple generations, until no infectious contacts are identified | |
| (7) Expedited partner therapy for multiple generations | Treat symptomatic cases | Same as Screening plus EPT scenario but: |
| Opportunistic screening and treatment | EPT goes back multiple generations, until no infectious contacts are identified | |
| EPT |
Appendix 1: Expected Yield of Contact Tracing and Partner Notification
Contact tracing and partner notification (CTPN) is a strategy commonly used for the control of sexually transmitted infections in Canada. Briefly, upon identification of an infected case of gonorrhea, syphilis, chlamydia or HIV, the relevant public health authorities interview the infected individual and identify their sexual contacts, who are in turn informed of their risk and encouraged to undergo testing, and if appropriate, treatment. There is variability in the application of CTPN in Canada; some jurisdictions perform only a single generation of CTPN while some perform multiple generations, with each infected identified contact now becoming the index case for a new round of CTPN. As all empirical estimates of the yield of CTPN of which we are aware suggest that the average number of new infectious cases identified per infected index case is < 1, it is possible to evaluate the expected yield of CTPN using simple mathematics. For example, if P is the average number of secondary infectious cases identified per infected index case, the number-needed-to-test to identify a single infectious case will be 1/P. Furthermore, the total number of infections (including the index case) that can be identified using a multi-generational CTPN strategy is (1/(1-P) (that is, the sum of a geometric series); the number of cases identified excluding the index case is simply (1/(1- P))-1.
This approach ignores the fact that the time taken to reach each subsequent generation of sex contacts might result in contacted individuals experiencing spontaneous resolution of infection, or receiving treatment of infection from other sources. This, however, counterbalances somewhat the possibility that individuals who were non-infected contacts become infected from other sources over time. Regardless, we treat the likelihood of infection in contacts of infected individuals as a fraction that is fixed over time. The figure below shows NNT and the total future stream of cases that might be identified via multigenerational CTPN. It can be seen that the efficiency of such an approach varies exponentially as the likelihood of identifying an infectious contact changes. For multi-generational contact tracing to identify, on average, one or more secondary infectious contacts, the probability of identifying a secondary infection for each primary case must be greater than or equal to 0.5, with the resulting requirement for at least two tests for identification.
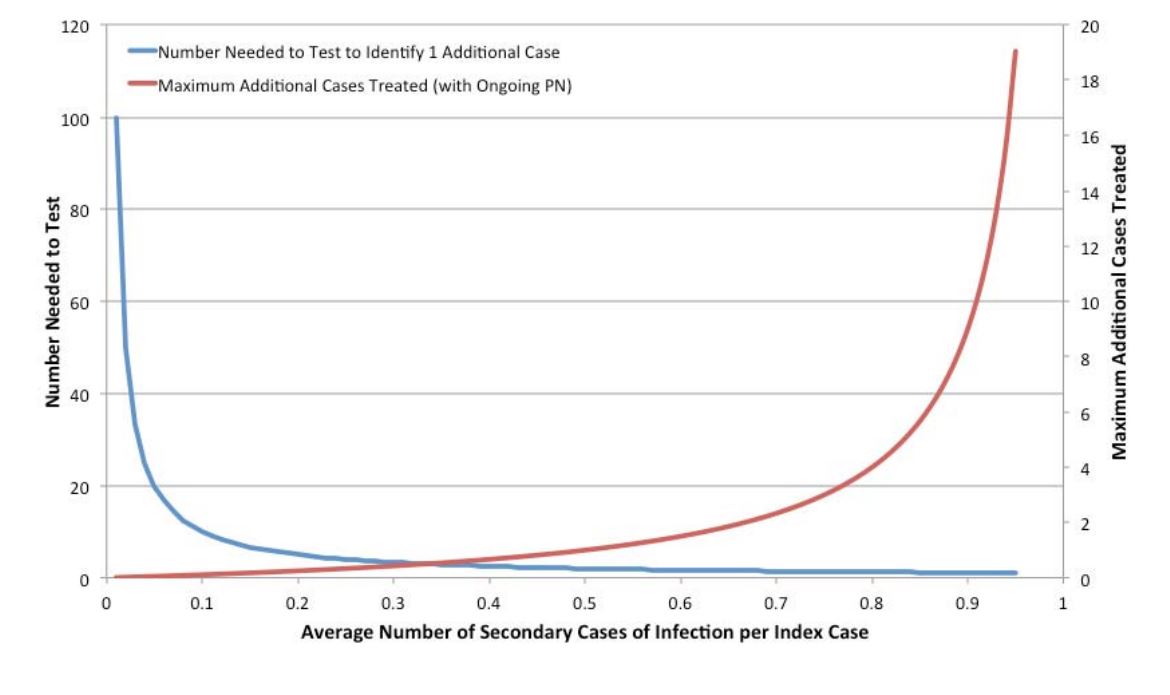
Figure 7. Projected Efficiency of Partner Notification by Probability of Identified Secondary Infections
References
1. Public Health Agency of Canada. Reported cases and rates of chlamydia by age group and sex, 1991 to 2009. Accessed 13 Jun 2011: http://www.phac-aspc.gc.ca/std-mts/sti-its_tab/chlamydia-eng.php.
2. Ota K, Tan D, Mishra S, Fisman DN. Sexually transmitted infections. In: Loeb M, Smaill F, Smieja M, editors. Evidence-based infectious diseases. 2nd ed. Hoboken, NJ: BMJ/Wiley-Blackwell; 2009. p. 136-76.
3. Turner CF, Rogers SM, Miller HG, Miller WC, Gribble JN, Chromy JR, et al. Untreated gonococcal and chlamydial infection in a probability sample of adults. JAMA. 2002 Feb 13;287(6):726-33.
4. Public Health Agency of Canada. Report on sexually transmitted infections in Canada, 2008. Accessed 13 Jun 2011: http://www.phac-aspc.gc.ca/std-mts/report/sti- its2008/index-eng.php.
5. WIlson JGM, Jungner G. Principles and practice of screening for disease. World Health Organization. Public Health Papers, No. 34. Accessed 29 Jun 2012: http://whqlibdoc.who.int/php/WHO_PHP_34.pdf. 1968.
6. Public Health Agency of Canada. Canadian guidelines on sexually transmitted infections. Accessed 13 Jun 2011: http://www.phac-aspc.gc.ca/std-mts/sti-its/guide- lignesdir-eng.php. 2008.
7. Brunham RC, Pourbohloul B, Mak S, White R, Rekart ML. The unexpected impact of a Chlamydia trachomatis infection control program on susceptibility to reinfection. The Journal of infectious diseases. 2005;192(10):1836-44.
8. Low N. Screening programmes for chlamydial infection: when will we ever learn? British Medical Journal. 2007;334(7596):725.
9. Fisman DN, Spain CV, Salmon ME, Goldberg M. The Philadelphia High-School STD Screening Program: key insights from dynamic transmission modeling. Sex Transm Dis. 2008 Nov;35(11 Suppl):S61-5.
10. Pinkerton SD. Sexual risk compensation and HIV/STD transmission: empirical evidence and theoretical considerations. Risk Anal. 2001 Aug;21(4):727-36.
11. Anschuetz GL, Beck JN, Asbel L, Goldberg M, Salmon ME, Spain CV. Determining risk markers for gonorrhea and chlamydial infection and reinfection among adolescents in public high schools. Sex Transm Dis. 2009 Jan;36(1):4-8.
12. Mardh PA, Novikova N. Chlamydia trachomatis infections—a major concern for reproductive health. Where do we stand regarding epidemiology, pathogenesis, diagnosis and therapy? Eur J Contracept Reprod Health Care. 2001 Jun;6(2):115-26.
13. Howell MR, Kassler WJ, Haddix A. Partner notification to prevent pelvic inflammatory disease in women. Cost-effectiveness of two strategies. Sex Transm Dis. 1997 May;24(5):287-92.
14. Trelle S, Shang A, Nartey L, Cassell JA, Low N. Improved effectiveness of partner notification for patients with sexually transmitted infections: systematic review. BMJ. 2007 Feb 17;334(7589):354.
15. Shiely F, Hayes K, Thomas KK, Kerani RP, Hughes JP, Whittington WL, et al. Expedited partner therapy: a robust intervention. Sex Transm Dis. 2010 Oct;37(10):602- 7.
16. Schillinger JA, Kissinger P, Calvet H, Whittington WL, Ransom RL, Sternberg MR, et al. Patient-delivered partner treatment with azithromycin to prevent repeated Chlamydia trachomatis infection among women: a randomized, controlled trial. Sex Transm Dis. 2003 Jan;30(1):49-56.
17. Golden MR, Whittington WL, Handsfield HH, Hughes JP, Stamm WE, Hogben M, et al. Effect of expedited treatment of sex partners on recurrent or persistent gonorrhea or chlamydial infection. N Engl J Med. 2005 Feb 17;352(7):676-85.
18. Stephens SC, Bernstein KT, Katz MH, Philip SS, Klausner JD. The effectiveness of patient-delivered partner therapy and chlamydial and gonococcal reinfection in San Francisco. Sex Transm Dis. 2010 Aug;37(8):525-9.
19. Garnett GP, Anderson RM. Contact tracing and the estimation of sexual mixing patterns: the epidemiology of gonococcal infections. Sex Transm Dis. 1993 Jul- Aug;20(4):181-91.
20. Ghani AC, Aral SO. Patterns of sex worker-client contacts and their implications for the persistence of sexually transmitted infections. J Infect Dis. 2005 Feb 1;191 Suppl 1:S34-41.
21. Ghani AC, Garnett GP. Risks of acquiring and transmitting sexually transmitted diseases in sexual partner networks. Sex Transm Dis. 2000 Nov;27(10):579-87.
22. Rank RG, Whittum-Hudson JA. Protective immunity to chlamydial genital infection: evidence from animal studies. J Infect Dis. 2010 Jun 15;201 Suppl 2:S168-77.
23. Batteiger BE, Xu F, Johnson RE, Rekart ML. Protective immunity to Chlamydia trachomatis genital infection: evidence from human studies. J Infect Dis. 2010 Jun 15;201 Suppl 2:S178-89.
24. Hu D, Hook EW, 3rd, Goldie SJ. Screening for Chlamydia trachomatis in women 15 to 29 years of age: a cost-effectiveness analysis. Ann Intern Med. 2004 Oct 5;141(7):501- 13.
25. Mehta SD, Bishai D, Howell MR, Rothman RE, Quinn TC, Zenilman JM. Cost- effectiveness of five strategies for gonorrhea and chlamydia control among female and male emergency department patients. Sex Transm Dis. 2002 Feb;29(2):83-91.
26. Gift TL, Kissinger P, Mohammed H, Leichliter JS, Hogben M, Golden MR. The cost and cost-effectiveness of expedited partner therapy compared with standard partner referral for the treatment of chlamydia or gonorrhea. Sex Transm Dis. 2011 Nov;38(11):1067-73.
27. Statistics Canada. The Consumer Price Index. Catalogue no. 62-001-X2010.
28. Weinstein MC, Siegel JE, Gold MR, Kamlet MS, Russell LB. Recommendations of the Panel on Cost-effectiveness in Health and Medicine. JAMA. 1996 Oct 16;276(15):1253-8.
29. Brisson M, Boily MC, Masse BR, Adrien A, Leaune V. Highlights of the sexual activity of the heterosexual population in the province of Quebec. Sex Transm Infect. 1999 Oct;75(5):296-9.
30. Chan CH, McCabe CJ, Fisman DN. Core groups, antimicrobial resistance and rebound in gonorrhoea in North America. Sex Transm Infect. 2012 Apr;88(3):200-4.
31. Tuite AR, Jayaraman GC, Allen VG, Fisman DN. Estimation of the burden of disease and costs of genital Chlamydia trachomatis infection in Canada. Sex Transm Dis. 2012 Apr;39(4):260-7.
32. Centers for Disease C, Prevention. CDC Grand Rounds: Chlamydia prevention: challenges and strategies for reducing disease burden and sequelae. MMWR Morb Mortal Wkly Rep. 2011 Apr 1;60(12):370-3.
33. Pourbohloul B, Rekart ML, Brunham RC. Impact of mass treatment on syphilis transmission: a mathematical modeling approach. Sex Transm Dis. 2003 Apr;30(4):297- 305.
34. Heijne JC, Althaus CL, Herzog SA, Kretzschmar M, Low N. The role of reinfection and partner notification in the efficacy of Chlamydia screening programs. J Infect Dis. 2011 Feb 1;203(3):372-7.
35. Turner K, Adams E, Grant A, Macleod J, Bell G, Clarke J, et al. Costs and cost effectiveness of different strategies for chlamydia screening and partner notification: an economic and mathematical modelling study. BMJ. 2011;342:c7250.
36. Scholes D, Stergachis A, Heidrich FE, Andrilla H, Holmes KK, Stamm WE. Prevention of pelvic inflammatory disease by screening for cervical chlamydial infection. N Engl J Med. 1996 May 23;334(21):1362-6.
37. Pandemic Influenza Outbreak Research Modelling T, Fisman D. Modelling an influenza pandemic: A guide for the perplexed. CMAJ. 2009 Aug 4;181(3-4):171-3.
38. van Valkengoed IG, Morre SA, van den Brule AJ, Meijer CJ, Bouter LM, Boeke AJ. Overestimation of complication rates in evaluations of Chlamydia trachomatis screening programmes–implications for cost-effectiveness analyses. Int J Epidemiol. 2004 Apr;33(2):416-25.
39. Lipsitch M, Bergstrom CT, Levin BR. The epidemiology of antibiotic resistance in hospitals: paradoxes and prescriptions. Proc Natl Acad Sci U S A. 2000 Feb 15;97(4):1938-43.
40. Galvani AP, Reluga TC, Chapman GB. Long-standing influenza vaccination policy is in accord with individual self-interest but not with the utilitarian optimum. Proc Natl Acad Sci U S A. 2007 Mar 27;104(13):5692-7.
41. Golden MR, Hogben M, Handsfield HH, St Lawrence JS, Potterat JJ, Holmes KK. Partner notification for HIV and STD in the United States: low coverage for gonorrhea, chlamydial infection, and HIV. Sex Transm Dis. 2003 Jun;30(6):490-6.
42. Tao G, Tian LH, Peterman TA. Estimating Chlamydia screening rates by using reported sexually transmitted disease tests for sexually active women aged 16 to 25 years in the United States. Sex Transm Dis. 2007 Mar;34(3):180-2.
43. Kretzschmar M, van Duynhoven YT, Severijnen AJ. Modeling prevention strategies for gonorrhea and Chlamydia using stochastic network simulations. Am J Epidemiol. 1996 Aug 1;144(3):306-17.
44. Geisler WM. Duration of untreated, uncomplicated Chlamydia trachomatis genital infection and factors associated with chlamydia resolution: a review of human studies. J Infect Dis. 2010 Jun 15;201 Suppl 2:S104-13.
45. Watson EJ, Templeton A, Russell I, Paavonen J, Mardh PA, Stary A, et al. The accuracy and efficacy of screening tests for Chlamydia trachomatis: a systematic review. J Med Microbiol. 2002 Dec;51(12):1021-31.
46. Oakeshott P, Kerry S, Aghaizu A, Atherton H, Hay S, Taylor-Robinson D, et al. Randomised controlled trial of screening for Chlamydia trachomatis to prevent pelvic inflammatory disease: the POPI (prevention of pelvic infection) trial. BMJ. 2010;340:c1642.
47. Risser WL, Risser JM. The incidence of pelvic inflammatory disease in untreated women infected with Chlamydia trachomatis: a structured review. Int J STD AIDS. 2007 Nov;18(11):727-31.
48. Haggerty CL, Gottlieb SL, Taylor BD, Low N, Xu F, Ness RB. Risk of sequelae after Chlamydia trachomatis genital infection in women. J Infect Dis. 2010 Jun 15;201 Suppl 2:S134-55.
49. Stamm WE, Koutsky LA, Benedetti JK, Jourden JL, Brunham RC, Holmes KK. Chlamydia trachomatis urethral infections in men. Prevalence, risk factors, and clinical manifestations. Ann Intern Med. 1984 Jan;100(1):47-51.
50. Lau CY, Qureshi AK. Azithromycin versus doxycycline for genital chlamydial infections: a meta-analysis of randomized clinical trials. Sex Transm Dis. 2002 Sep;29(9):497-502.
51. Schwebke JR, Rompalo A, Taylor S, Sena AC, Martin DH, Lopez LM, et al. Re- evaluating the treatment of nongonococcal urethritis: emphasizing emerging pathogens–a randomized clinical trial. Clin Infect Dis. 2011 Jan 15;52(2):163-70.
52. Estcourt C, Sutcliffe L, Cassell J, Mercer CH, Copas A, James L, et al. Can we improve partner notification rates through expedited partner therapy in the UK? Findings from an exploratory trial of Accelerated Partner Therapy (APT). Sex Transm Infect. 2012 Feb;88(1):21-6.
53. Smith KJ, Tsevat J, Ness RB, Wiesenfeld HC, Roberts MS. Quality of life utilities for pelvic inflammatory disease health states. Sex Transm Dis. 2008 Mar;35(3):307-11.
54. Appendix 2: Chlamydia. In: Stratton KR, Durch JS, Lawrence RS, editors. Vaccines for the 21st Century: A Tool for Decision Making. Washington, DC: National Acadamy Press; 2000. p. 149-58.
55. Chesson HW, Blandford JM, Gift TL, Tao G, Irwin KL. The estimated direct medical cost of sexually transmitted diseases among American youth, 2000. Perspect Sex Reprod Health. 2004 Jan-Feb;36(1):11-9.
56. Cohen H. Drug topics red book. Montvale, NJ: Thompson PDR; 2003.
ISBN 978-1-927988-12-1
