…dates for each site: City wastewater Halifax 2023-03-08 Montreal 2023-03-11 Edmonton 2023-03-12 Toronto 2023-03-12 Vancouver 2023-03-12 1 of 6 https://www.sciencedirect.com/science/article/pii/S1755436522000172 Vancouver The reported clinical data (black curve) when compared to…
…dates for each site: City wastewater Halifax 2024-02-07 Montreal 2024-02-10 Edmonton 2024-02-11 Toronto 2024-02-11 Vancouver 2024-02-11 1 of 6 https://www.sciencedirect.com/science/article/pii/S1755436522000172 Vancouver The reported clinical data (black curve) when compared to…
…dates for each site: City wastewater Edmonton 2023-06-25 Halifax 2023-06-28 Montreal 2023-07-01 Toronto 2023-07-02 Vancouver 2023-07-02 1 of 6 https://www.sciencedirect.com/science/article/pii/S1755436522000172 Vancouver The reported clinical data (black curve) when compared to…
…dates for each site: City wastewater Edmonton 2023-01-22 Halifax 2023-01-25 Montreal 2023-01-28 Toronto 2023-01-29 Vancouver 2023-01-29 1 of 6 https://www.sciencedirect.com/science/article/pii/S1755436522000172 Vancouver The reported clinical data (black curve) when compared to…
…dates for each site: City wastewater Halifax 2024-03-06 Montreal 2024-03-09 Edmonton 2024-03-10 Toronto 2024-03-10 Vancouver 2024-03-10 1 of 6 https://www.sciencedirect.com/science/article/pii/S1755436522000172 Vancouver The reported clinical data (black curve) when compared to…
…dates for each site: City wastewater Halifax 2024-03-27 Montreal 2024-03-30 Edmonton 2024-03-31 Vancouver 2024-03-31 Toronto 2024-04-02 1 of 6 https://www.sciencedirect.com/science/article/pii/S1755436522000172 Vancouver The reported clinical data (black curve) when compared to…
…dates for each site: City wastewater Halifax 2022-12-21 Edmonton 2022-12-25 Montreal 2022-12-31 Toronto 2023-01-01 Vancouver 2023-01-01 1 of 6 https://www.sciencedirect.com/science/article/pii/S1755436522000172 Vancouver The reported clinical data (black curve) when compared to…

…Glossary of Terms COVID-19 Modelling Glossary of Terms Using and Understanding the Mathematical Model Based on a probabilistic model, this online calculator estimates some components of the epidemiological risks associated…
…dates for each site: City wastewater Edmonton 2023-08-06 Halifax 2023-08-09 Montreal 2023-08-12 Toronto 2023-08-13 Vancouver 2023-08-13 1 of 6 https://www.sciencedirect.com/science/article/pii/S1755436522000172 Vancouver The reported clinical data (black curve) when compared to…
…genders) Friends and Social Network Former Patients / People with lived TB experience Community Voices, Representatives, Champions First Nations, Inuit and Métis Community Leadership (particularly from affected communities) – Chiefs…
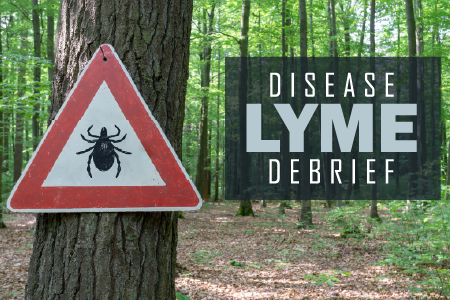
…about 987 total cases of Lyme disease were reported in the province compared to only 388 cases in 2016. Recently, Public Health Ontario has issued estimated risk areas (geographic communities)…
…shortness of breath. Pneumonia is a common finding. Gastrointestinal symptoms, include anorexia, nausea, vomiting, abdominal pain and diarrhea. Severe illness can cause serious complications such as respiratory and kidney failure….


