POPULATION HEALTH SUMMARY MEASURES
HALYs, DALYs and QALYs are types of population health summary measures. They can be estimated at international, national or local levels to:
- Compare population health across communities and over time;
- Provide a full picture of which diseases, injuries, and risk factors contribute the most to poor health in a specific population (this is probably the most common use of summary measures of health);
- Assess which information or sources of information are missing, uncertain, or of low quality (5).
Measures of HALYs, including DALYs and QALYs, are normally presented by age, sex and geographical region.
Introduction
The ability to consistently describe the relative importance of diseases is important for public health decision-making and planning (1). Summary measures of the burden of disease in a population are popular and widely used, as they can simplify complex information about diseases, including risk factors, and the likelihood of resulting disability or other harm (morbidity), or death (mortality) (2).
Health-Adjusted Life Years (HALYs) are the population health summary measures typically used in estimates of the burden of disease. They measure the combined effects of mortality and morbidity in populations, allowing for comparisons across illnesses or interventions as well as between populations (3). Two common approaches to measuring HALYs are Disability-Adjusted Life Years (DALYs) and Quality-Adjusted Life Years (QALYs).
Both DALYs and QALYs are based on the latest available epidemiological data. The data must be assessed for completeness and diagnostic accuracy, and can be drawn from a variety of sources, such as vital statistics, reportable disease registries, healthcare administration databases, censuses, national and local surveillance data, autopsies, hospital records, surveys (e.g., road safety, institutional, household or health surveys), police records, death certificates and mortuary records. Ideally, all the data should be valid, timely, locally derived, and disaggregated by age and sex (4). It is important to note that health conditions are often under-reported or underdiagnosed.
Regardless of whether DALYs, QALYs or some other calculations of HALYs are measured, there are three steps involved:
- The health state or disease conditions associated with a pathogen or disease analysed are defined and described (morbidity)
- Each health state described in step 1 is given a weighted value, often called a Health-Related Quality of Life (HRQL) value; and
- The value of each health state is combined with estimates of life expectancy (mortality) (3).
Each of these steps includes methods and social value choices that affect the final estimates. Both DALYs and QALYs are used to estimate HALYs and the burden of disease. However, they are used for different purposes, and are therefore calculated in different ways.
Disability-Adjusted Life Years (DALYs)
DALYs are currently the most common methods used for estimating burden of disease. For example, they were used in the 2012 international reports on the Global Burden of Disease (GBD 2010). DALYs measure the difference between the current state of population health and an ideal situation; i.e., where everyone reaches the age of standard life expectancy in perfect health (6). DALYs are based on an assumption that “time” is the most appropriate measure for the burden of disease: the greater the time lived with a disability, or with the disabling results of an illness, or lost due to premature mortality, the greater the burden of disease is considered to be (6).
DALYs measure the total length of time that a specific illness is disabling to an individual over the course of his or her life. When applied to a population, they are the measure of the total disability incurred due to a specific disease (7).
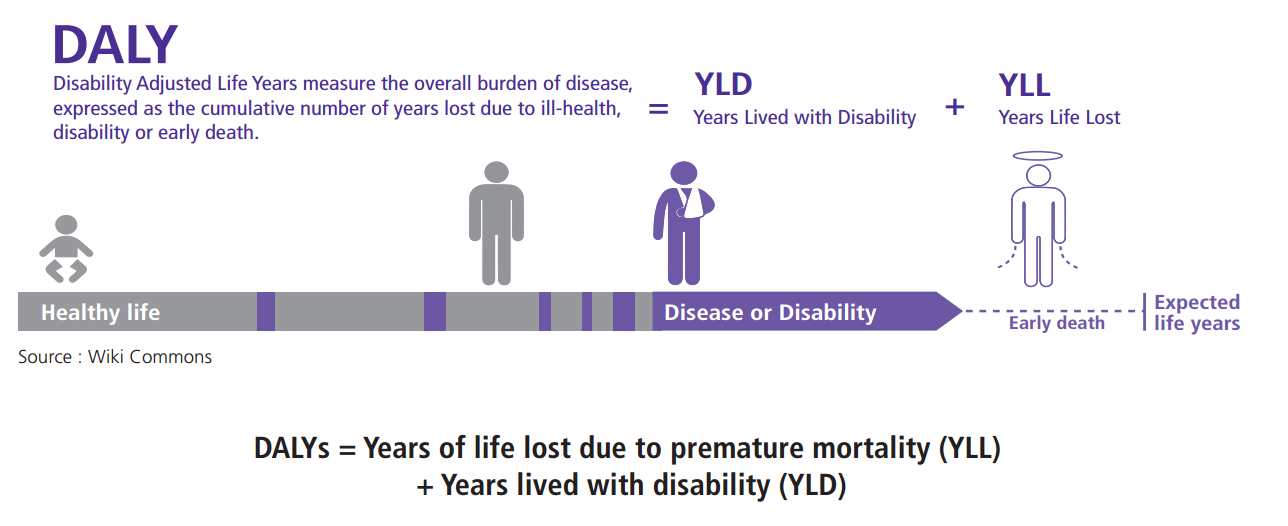
DALYs = Years of life lost due to premature mortality (YLL) + Years lived with disability (YLD)
YLL correspond to the number of deaths multiplied by a standard life expectancy. So we have:
YLL = N (number of deaths at age x) x L (standard of life expectancy at age x in years)
YLD is measured by multiplying the number of disability cases (i.e., incidence cases) by the average duration of the disease or disability, with a weighted value assigned to the type of disability (disability weight) (5).
That is:
YLD = I (number of incident cases) x DW (disability weight) x L (average duration of the case until remission or death in years)
In the case of the GBD 2010, YLD calculations were based on prevalence instead of incidence (5):
YLD = P (number of prevalent cases) x DW (disability weight)
ABOUT DALYs
Disability-adjusted life years are an absolute measure used to compare disease burden in populations. The goal is to minimize the “bad” of gaps in health, keeping the values of DALYs as close to 0 as possible.
DALYs use disability weights (0 = perfect health and 1 = death) which are generated through consultations with clinicians, experts or community.
In DALYs, the HRQL estimates are associated with the physical manifestations of a specific disease in a population. They do not capture other aspects of a disease, such as the psychological effects on relatives (8). The HRQL or disability weights used in DALYs are assigned to non-fatal health outcomes (4) for specific diseases or health conditions on a scale between 0 and 1, where 0 represents perfect health and 1 represents death (3). The disability weights are based on codes from the International Statistical Classification of Diseases, Injuries and Causes of Death (ICD).
In the past, DALY estimates also included a weighting for age. The weighting was more favourable for adults who were “productive” in their communities and contributing to the economy, diminishing the value of young people as well as older adults who were more likely to be economically dependent.
It reflected some societies’ interest in labour market productivity and receiving a return on their investment in educating children. In fact, one of the main concerns about DALYs is that they are mostly an economic measure of capacity for productivity among affected individuals. Age weighting remains controversial. Recent burden of disease reports have not made use of it.
There are other social values incorporated in DALYs. For example, cultures and countries may value lives saved now and discount lives saved in succeeding years. In the GBD 2010 report, for instance, estimates for future years were generally discounted at a rate of 3%. This means that a year of life saved next calendar year is worth 97% of a year of life saved this calendar year (9). When comparing estimates of the burden of disease, it is important to know how social values are included in them, and that the results will be different according to the weightings used.
Quality-Adjusted Life Years (QALYs)
ABOUT QALYs
Quality-adjusted life years are usually used to analyse clinical interventions. The goal is to maximize the “good” of quality of life.
QALYs use utility weights (0 = death and 1 = perfect health) generated through techniques such as standard gamble (asking respondents to assess which health states are more valuable to them).
QALYs, as the name implies, measure both the quantity and the quality of life lived. They are typically used to analyse the cost-effectiveness of clinical (or public health) interventions and for social welfare improvement (3). For example, QALYs can compare an intervention that helps prolong life but has serious side effects (such as permanent disability caused by radiation or chemotherapy for cancer), with an intervention that improves the quality of life without prolonging it (such as palliative pain management) (10).
The HRQL in QALYs is not linked to any particular disease. It is based on values assigned by individuals about their own health state (known as patient-based weights) or on the values assigned by others about a particular health state (community-based weights) (3). Respondents are asked to assign a numerical value to what they would be willing to sacrifice in order to return from poor to perfect health, where a year of perfect health is given a value of 1 and death is considered to be 0. If the year is not spent in perfect health (e.g., living with chronic pain), the value is between 1 and 0.
This score takes into account five dimensions: a) mobility, b) pain or discomfort, c) self-care, d) anxiety-depression, and e) usual activities (11).
This means that QALY estimates are able to integrate psycho-social as well as biomedical aspects of the burden of a disease.
QALYs are calculated by multiplying the number of years of additional life by an HRQL.
QALYs = additional number years of life x HRQL
To estimate the cost-effectiveness of an intervention, the cost is divided by the QALY (11).
QALYs can provide an indication of the benefits gained from a medical intervention in terms of quality of life, but their usefulness is controversial. It has been argued that serious ill health may be considered worse than death. Others have noted that what is considered perfect health varies by culture and society. Furthermore, QALYs lack the sensitivity to compare two competitive but similar drugs or to evaluate treatment for less severe health problems (11).
The effects of chronic diseases, where quality of life is a major issue but survival is not, are also difficult to address using QALYs. In such cases, disease-specific measures such as DALYs may be more appropriate. Another criticism of QALYs is the lack of weight on emotional or mental health problems, and the impact of these problems on the quality of life of individuals and their families. Similarly, because QALYs rely on measures of age, context, and responsibilities in different life stages, they can be difficult to quantify if a preventative measure will not have an effect on health outcome in the short term (11).
Despite these limitations, QALYs are one of the few tools that allow for comparisons between interventions or across diseases. Using QALYs for decisions on resource allocation helps to articulate the choices to be made between competing medical therapies or technologies (11). Nevertheless, researchers caution that QALYs should not be used in isolation, because they do not capture all the domains and aspects of healthcare (12).
HRQL in DALYs and QALYs Measure Different Things
HRQLs used in QALYs and DALYs are inverted: QALYs measure equivalent healthy years lived, whereas DALYs measure loss of health.
In DALYs:
0________________________________________________1
Perfect health Death
In QALYs:
0________________________________________________1
Death Perfect health
In DALYs, HRQL weights are based on specific diseases. In QALYs, HRQL weights are based on the values placed on a health state.
Ethical Concerns
Critics have commented on three major ethical issues with QALY and DALY estimates:
- QALYs and DALYs discriminate against people who are already at a disadvantage socially or in terms of their health state. Indeed, based on actual calculations, older people, or people with pre-existing disabilities, contribute to lower HALY values because they are considered a “bad investment” with limited potential for health improvement;
- Similarly, both discriminate against people with limited treatment options or less likelihood of recovery (e.g., those with pre-existing disabilities or illness); and
- Both fail to account for qualitative differences in outcome (e.g., the saving of one’s life versus the improving of one’s health) because of the way in which morbidity and mortality outcomes are aggregated. The problem is that the values for health states and diseases are combined across individuals, and across the spectrum of being alive to death. This means that there is no real distinction between life-saving interventions and health-improving interventions. The issue of aggregation also raises the question of whether minor benefits for many people should be valued the same way as significant benefits for a few people (3).
New techniques that better reflect social values are in development, and may help to address these ethical problems more satisfactorily.
Conclusions
It is important to understand what burden of disease studies measure, including the assumptions that are made in developing the basic formulas for HALYs, DALYs, and QALYs. Data sources, methodologies used, and weights given to different states of disability and poor health all need to be taken into consideration when assessing the results provided. Differences in risk factors associated with different provinces, rural versus urban settings, and northern versus southern communities may show some important variations that could be underestimated in a single measure. Policy makers must take into account that DALY and QALY estimates are not strictly objective, and can only provide some of the information needed to understand the distribution of morbidity and mortality and how to allocate resources that can improve health and save lives.
The National Collaborating Centre for Infectious Diseases is developing new resources for public health policy makers and practitioners that review the evidence for other ways to measure and account for burden of disease. The concepts and practical applications will build upon traditional summary measures of mortality and morbidity. These expanded resources will encompass upstream drivers of infectious diseases and their associated burden, as well as other outcomes for individuals, families and communities.
References
(1) About the global burden of disease. 2013; Available at: http://www.who.int/healthinfo/global_burden_disease/about/en/index.html.
(2) Mathers CD, Ezzati M, Lopez AD. Measuring the burden of neglected tropical diseases: the global burden of disease framework. PLoS Negl Trop Dis 2007 Nov 7;1(2):e114.
(3) Gold MR, Stevenson D, Fryback DG. HALYS and QALYS and DALYS, Oh My: similarities and differences in summary measures of population Health. Annu Rev Public Health 2002;23:115-134.
(4) Lozano R, Naghavi M, Foreman K, Lim S, Shibuya K, Aboyans V, et al. Global and regional mortality from 235 causes of death for 20 age groups in 1990 and 2010: a systematic analysis for the Global Burden of Disease Study 2010. Lancet 2012 Dec 15;380(9859):2095-2128.
(5) Murray CJ, Vos T, Lozano R, Naghavi M, Flaxman AD, Michaud C, et al. Disability-adjusted life years (DALYs) for 291 diseases and injuries in 21 regions, 1990-2010: a systematic analysis for the Global Burden of Disease Study 2010. Lancet 2012 Dec 15;380(9859):2197-2223.
(6) Young TK. Population health: concepts and methods. 2nd ed. New York, N.Y.: Oxford University Press; 2005.
(7) Author. Global context of mental Health and Mental Disorders. On-line presentation 2012; . Accessed at: www.slideshare.net/teenmentalhealth/global-context-of-mental-health-and-mental-disorders-presentation January 30, 2014.
(8) Thacker SB, Stroup DF, Carande-Kulis V, Marks JS, Roy K, Gerberding JL. Measuring the public’s health. Public Health Rep 2006 Jan-Feb;121(1):14-22.
(9) Author. Metrics: Disability-adjusted life year (DALY). 2013; World Health Organization. Available at: http://www.who.int/healthinfo/global_burden disease/metrics_daly/en/index.html.
(10) Neumann PJ, Zinner DE, Wright JC. Are methods for estimating QALYs in cost-effectiveness analyses improving? Med Decis Making 1997 Oct- Dec;17(4):402-408.
(11) Phillips C. What is a QALY? What is? Series. Oxford University. 2009.
(12) Malek M. Implementing QALYs. What is? Series. Oxford University. 2001.
(13) Kwong J, Institute for Clinical Evaluative Sciences in Ontario. Ontario burden of infectious disease study. 2010
The Ontario Burden of Infectious Disease Study (ONBOIDS)
The ONBOIDS was published in 2010 (13). To measure the burden of infectious diseases, the authors of this study used a HALY as a health gap measure to assess both the premature mortality and the reduced functioning associated with diseases or injuries that they considered neither a DALY nor a QALY (this predates the release of the GBD 2010 papers, which did not use age weighting either, as noted).
In the ONBOIDS:
HALYs = Years of life lost (YLL)
+ Year-equivalent of reduced functioning (YERF)
YERFc,h,a,s = Ic,h,a,s x Dc,h x SWc,h
where:
Ic,h,a,s = incident cases by cause (c), health state (h), age (a) and sex (s) Dc,h = average duration of health state
SWc,h = severity weight associated with health state
The disease burden was estimated by pathogen and by syndrome. For example, data might be gathered on the incidence or prevalence of Streptococcus pneumoniae infections and on the incidence or prevalence of diagnoses of pneumonia. ONBOIDS included analyses of 51 pathogens and 16 syndromes that were severe enough to require health care or which were reportable, adjusting for under-diagnosis and under-reporting. The study found that each year in Ontario there were more than seven million episodes of infectious diseases and nearly 4,900 resulting deaths. Infectious diseases accounted for 82,881 HALYs, comprising 68,213 years of life lost due to premature death and 14,668 year-equivalents of reduced functioning. The overall burden of infectious disease represented about 25% of the burden of all cancers. The burden of infectious diseases was similar for males and for females, although there were sex-specific differences.
The ten infectious agents contributing the most to the burden of disease were the hepatitis C virus, Streptococcus pneumoniae, the human papilloma virus, the hepatitis B virus, Escherichia coli, HIV/AIDS, Staphylococcus aureus, influenza, Clostridium difficile and rhinovirus. The five most burdensome syndromes were pneumonia, septicaemia, urinary tract infections, acute bronchitis, and endocarditis. Women had greater HALYs for HPV and urinary tract pathogens, while HIV, HBV, and HCV were more predominant among men. The study also showed that a large proportion of the burden of disease could be attributed to a small number of pathogens and syndromes for which highly effective targeted interventions (e.g., pneumonia or HPV vaccine) and non-specific interventions (e.g., condoms, hand washing) already existed. This means that the future burden of some of these pathogens and syndromes could be dramatically reduced with a greater uptake of available interventions. In addition, a significant proportion of disease burden (e.g., E. coli, S. aureus) occurs in hospitals and health-care settings. This underlines the importance of preventing the transmission of pathogens there.
You may be interested in other publications issued by NCCID and its partners, as part of a suite of knowledge products related to the prevention and control of influenza. The collaborative Influenza and Influenza-like Illness Project is leveraging the expertise of six National Collaborating Centres on Public Health to address recognized knowledge gaps as well as the needs of public health and primary care professionals who work in influenza prevention. Questions remain about estimates of the burden of influenza, surveillance methods, the effectiveness of vaccination and other prevention strategies, and the equitable delivery of services. Documents within the series address these and other issues. Learn more about the influenza project at www.nccid.ca/influenza.
Was this useful? Share your feedback with nccid@umanitoba.ca.
Production of this document has been made possible through a financial contribution from the Public Health Agency of Canada through funding for the National Collaborating Centres for Public Health (NCCPH).
The views expressed herein do not necessarily represent the views of the Public Health Agency of Canada. Information contained in the document may be cited provided that the source is mentioned.